
Employee satisfaction metrics are quantifiable indicators, such as employee Net Promoter Score (eNPS) and absenteeism rate, that show how workers feel about their jobs before turnover data confirms it. A warehouse can lose forklift operators inside their first 90 days while the annual turnover report still reads "average." Measuring satisfaction on warehouse floors, construction sites, and manufacturing lines takes different methods than an office survey. This guide covers those five metrics, the levers that move them, and the tools to collect them.
TL;DR
- Employee satisfaction metrics show how workers feel about their jobs before turnover data confirms it.
- Track five metrics: eNPS, absenteeism, survey response rate, recognition frequency, and internal mobility.
- Scheduling, equipment, safety, recognition, and growth are the levers that move those metrics.
- Measurement tools fall into four categories with different frontline reach.
- SMS-based platforms like Yourco collect satisfaction data by text on any phone, with no app or login.
What Are the Top 5 Employee Satisfaction Metrics?
The five employee satisfaction metrics that most reliably predict retention in frontline workforces are eNPS, absenteeism and no-show rate, survey response rate, recognition frequency, and internal mobility rate. Human resources (HR) teams can track each one without a company email address and collect several by text message (SMS). HR systems provide absenteeism and internal mobility data.
1. Employee Net Promoter Score (eNPS)
eNPS uses one question to measure loyalty: how likely are you to recommend this company as a place to work, on a scale of 0 to 10? Employees scoring 9–10 are promoters, 7–8 are passives, and 0–6 are detractors. Subtracting the detractor percentage from the promoter percentage gives a score between −100 and +100. Shift-based roles score lower than office populations, so the useful comparison is a site's own quarter-over-quarter trajectory.
When eNPS drops, supervisor relationships are the first place to look. Fair and respectful treatment from a manager is a commonly cited driver of hourly-worker satisfaction, so an open follow-up about how supervisors treat workers on shift is a useful companion to the eNPS question.
2. Absenteeism and No-Show Rate
The absenteeism rate expresses unplanned absences as a share of scheduled work time, and it is often the first measurable signal of burnout. Burnout rarely announces itself, so a rising rate often arrives well before a resignation does.
Voluntary departures, the outcome that absence tends to precede, vary sharply by sector. 1.4% of manufacturing employment quit in an average month during 2025, against 3.9% in leisure and hospitality, according to Bureau of Labor Statistics turnover data. A national figure sets scale rather than a target, since the same absence rate carries different weight in a plant than in a hotel.
A sustained climb against a site's own prior quarters warrants investigation, and no-shows are worth tracking separately from called-in absences, since the two point at different problems. Scheduling is among the strongest levers for reducing both.
3. Survey Response Rate
Survey response rate tracks the share of frontline workers who complete the feedback sent to them, and it doubles as an engagement metric. When workers stop answering, they have stopped believing anything changes. Desk-based benchmarks mislead here, because most frontline workers have no company inbox for a survey to arrive in.
Survey links sent by text reach personal phones directly, and QR codes posted near time clocks give on-site access for workers who prefer it. Treating completion as paid work time establishes feedback as legitimate work rather than a personal favor.
4. Recognition Frequency
Recognition frequency records how often employees receive specific praise for their work. Well-recognized employees are 45% less likely to have turned over after two years, according to Gallup research tracking nearly 3,500 employees from 2022 to 2024. Weekly recognition serves frontline teams better than annual awards, and a monthly two-question pulse measures it: "In the past month, have you received specific praise for your work?" and "Do you feel management notices your contributions?"
A text shout-out sent minutes after a supervisor spots good work lands while the moment still matters, which an unread email never does. Frequency matters more than formality here, since specific praise repeated weekly is often more effective than a single elaborate award.
5. Internal Mobility Rate
The internal mobility rate divides internal movements, including promotions and lateral roles, by the average headcount. Career development is a commonly cited reason frontline employees give for planning to leave, and workers who move into a new role early tend to stay longer. Published criteria for moving from general labor to machine operator or crew lead make the path visible, and mobile-friendly training lets workers finish it without a computer.
Two questions measure whether that lands: "Do you have access to training that helps you improve your skills?" and "Do you understand what it takes to advance in this company?" Both are short enough to run as a quarterly pulse alongside the recognition questions.
What Are the Best Ways to Boost Frontline Retention and Engagement?
The five levers that move frontline satisfaction metrics are predictable scheduling, equipment quality, physical safety, recognition frequency, and growth pathways. Each one maps to a metric above, so improvements show up in the numbers rather than in sentiment alone.
- Predictable scheduling: work-life balance for frontline workers starts with knowing shifts in advance. Two weeks of advance notice and shift-swap options let employees manage childcare, education, and second jobs without last-minute disruption.
- Equipment quality: functioning tools show respect. Workers who spend shifts working around broken machinery lose time and patience, and the frustration shows up in eNPS before it shows up in turnover.
- Physical safety: regular hazard reviews and a culture where reporting a hazard carries no penalty build the security that engagement rests on.
- Recognition frequency: frontline work is repetitive and physically demanding, so timely praise for a hard shift does more for morale than an annual award ceremony.
- Growth pathways: clear criteria for advancement and mobile-friendly training let workers picture a longer career, which is what internal mobility rate measures.
Scheduling and recognition tend to produce the fastest measurable movement, since both can change within a single pay period. Equipment, safety, and growth pathways take longer to register but hold longer once they do.
Why Track First-Year Turnover Separately From the Five Metrics?
Tenure cohorts show the turnover that satisfaction metrics are meant to predict, so they serve as supporting context rather than a sixth metric. A single annual number hides where losses concentrate. Splitting voluntary departures into 0–90 days, 90–365 days, and 1+ years locates them: heavy losses in the first cohort point to onboarding and early supervisor relationships, while a mid-tenure spike points to training and scheduling.
Replacing an employee can cost between 50% and 200% of their annual salary, depending on their level, according to SHRM research. Monthly cohort reporting with 30-, 60-, and 90-day check-ins surfaces rising early departures while HR can still address onboarding, workload, management, or job-fit concerns.
What Are the Best Employee Satisfaction Measurement Tools?
The best employee satisfaction measurement tools for frontline workforces reach workers without a company email address or an app download. Four categories account for most of the market: enterprise engagement suites, human resources information system (HRIS)-embedded tools, pulse-survey add-ons, and SMS-based platforms.
Enterprise suites suit organizations with a people-analytics team, and pulse add-ons suit teams whose workers already read email at work. HRIS-embedded tools make sense for a company already running that HR system, since employee data pre-populates and surveys trigger on lifecycle events.
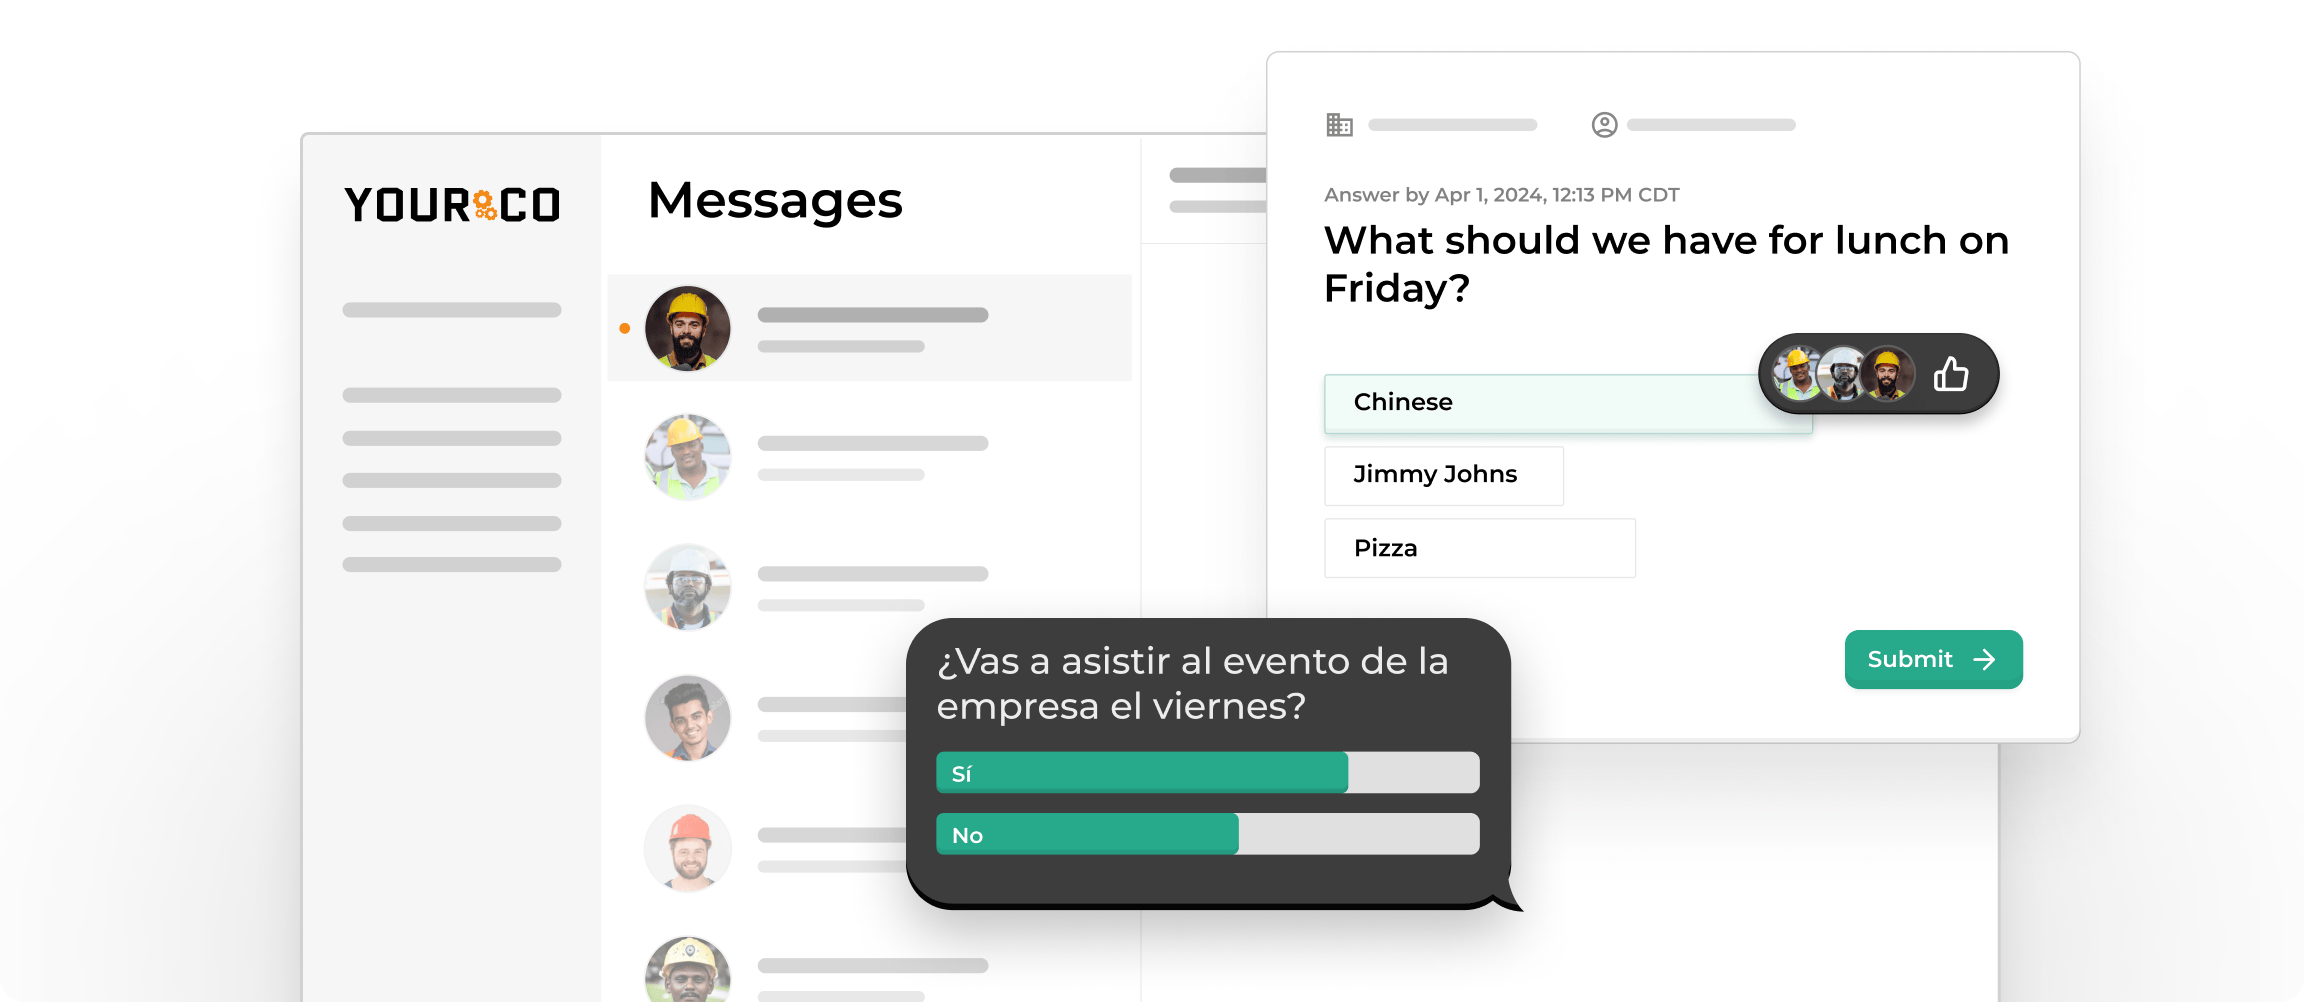
SMS-based platforms like Yourco send surveys as plain text to any phone, including basic flip phones, with no app download or login. 91% of HR leaders say the use of SMS increases frontline employee response rates, according to a Yourco-commissioned survey of 150 HR leaders. That is the trade these platforms make: participation over predictive modeling.
How Should You Design Satisfaction Surveys for Frontline Workers?
Frontline satisfaction surveys work best when they are short, operational, and answerable on a phone in under two minutes. A workable cadence is quarterly for full engagement surveys, plus monthly pulses of five to eight questions. Respondents score statements from "strongly disagree" to "strongly agree," including validated items from the Gallup Q12 such as "My supervisor, or someone at work, seems to care about me as a person."
Frontline surveys also carry specifics an office survey would never ask, such as "Did you have adequate tools for your tasks?" Those operational items are what separate a usable frontline instrument from a repurposed office one.
Schedule questions deserve their own block, since scheduling drives more hourly retention decisions than most other levers. Advance notice and shift-swap ability measure well on 5-point emoji scales, paired with a question on shift-timing consistency and one open prompt: "What would improve your schedule satisfaction?" Setting a minimum response threshold before breaking results down by shift keeps small samples from reading as trends. Guidance on managing employee surveys covers cadence and question design.
How Do You Track Quality of Work Life for Frontline Teams?
Tracking Quality of Work Life (QWL) asks whether workers can do their jobs safely and effectively. It covers physical safety, working conditions, equipment quality, and management's responsiveness to reported problems. Satisfaction can drop regardless of wages when workers spend shifts fighting broken machinery, which is why equipment and safety questions belong in every quarterly questionnaire, with weekly safety pulses added in construction and manufacturing.
Employers that run structured safety and health management systems often report lower turnover, higher satisfaction and fewer incidents. Many frontline crews are multilingual, so translating safety and equipment feedback requests into the languages crews actually speak keeps those workers in the dataset.
How Do You Close the Feedback Loop After a Survey?
Closing the feedback loop means sharing aggregated results within 14 days, committing to two or three actions with named owners and completion dates, and sending a progress update within 30 days. Workers who never see anything change stop responding to the next survey, and falling participation corrupts every other metric in the set.
Email open rates say nothing about workers who never had an inbox, so outcomes make the better measure: whether workers can name the latest schedule or policy change, and whether they say management heard them. A three-line text reaches every shift without relying on bulletin boards. A documented process for acting on survey results keeps those commitments visible.
Reach Every Worker With Yourco
Yourco is an SMS-based employee communication platform that collects satisfaction data by text through eNPS questions, monthly pulses, and recognition messages that workers can reply to. It reaches the people who drive trucks, run lines, and clean rooms without a company email account. Three capabilities carry that:
- SMS to any mobile phone, including basic flip phones, with no app download
- Two-way messaging for surveys, pulses, and recognition replies
- AI-powered translation across 135+ languages and dialects
HRIS and payroll data flows in through Yourco's 240+ integrations, so contact records stay current without manual upkeep.
For organizations with 2,001+ employees, Enterprise Bridge enables one-way broadcasts from corporate leadership to the entire frontline, keeping every location aligned without requiring responses.
Frontline Intelligence gives HR and leadership teams centralized visibility into satisfaction signals across all locations. Leaders can track response rates and sentiment patterns site by site, seeing which locations respond to engagement campaigns and which go quiet.
"We have tried 3 text communication tools, and this is the best experience we've had by far. A consistent line of communication to our employees is one of the most important things, and Yourco is the most reliable system around."
— Terri Kasper, HR Manager, Calumet Carton Company
After 90 days on Yourco, companies see two-way employee engagement reach 86%.
Try Yourco for free today or schedule a demo and see the difference the right workplace communication solution can make in your company.
Frequently Asked Questions About Employee Satisfaction Metrics
What are the best employee satisfaction measurement tools?
The right tool depends on the channels a workforce already uses. Enterprise suites offer the deepest analytics, HRIS-embedded tools suit companies already on that HR system, and pulse add-ons fit desk-based teams. For workers without company email, SMS-based platforms like Yourco deliver surveys by text to any phone.
What are the best ways to boost frontline retention and engagement?
Five levers most reliably move frontline satisfaction: predictable scheduling, equipment quality, physical safety, recognition frequency, and clear growth pathways. Scheduling and recognition usually shift the fastest, because both can change within a single pay period, while growth pathways take longer to register.
How often should you measure employee satisfaction in frontline workforces?
Run full engagement surveys quarterly and short pulses monthly to catch problems between cycles. Keep pulses to five to eight questions that take under two minutes on a phone. Add new-hire check-ins at 30, 60, and 90 days, when the risk of leaving is highest.
What is a good survey response rate for frontline workers?
A rate well below desk-based benchmarks can still be strong, since most frontline workers have no company email address. Offering text-message delivery or on-site options such as QR codes and break-room tablets helps, and treating completion as paid work time helps too. A falling rate is itself a disengagement signal.
How do you survey frontline employees who don't have a company email address?
Two channels work without email: text-message delivery to personal phones, and on-site access through QR codes, shared tablets, or kiosks. Text reaches any device, including basic flip phones, and needs no login or app download, which makes it the most reliable single channel for reaching a whole frontline workforce.
What is a good eNPS score for a frontline workforce?
Any score above zero means promoters outnumber detractors, and a modest positive score can be healthy on the front line. Shift-based roles score lower than office populations, so the useful benchmark is an organization's own industry and its trend over time.