
Frontline turnover often outpaces the reporting cycles HR teams rely on. If you're an HR director or operations leader in retail, manufacturing, hospitality, or logistics, the right metrics can flag who's likely to leave before a resignation is filed.
Tracking overall headcount and turnover tells you what happened; the right frontline workforce metrics tell you what's coming and what to do about it. This guide covers the retention, engagement, productivity, and predictive metrics that enterprise HR teams should track, with formulas and sector benchmarks for each.
TL;DR
- Frontline retention metrics like regrettable attrition and 90-day quit rates reveal problems that overall turnover numbers hide
- Engagement indicators, including eNPS, absenteeism rates, and recognition frequency, are leading signals of retention risk
- Productivity metrics such as revenue per employee and time-to-productivity quantify the true cost of turnover beyond replacement hiring
- Training completion rates and internal mobility help predict whether frontline employees stay past year one
- Predictive flight-risk scores and manager effectiveness composites are moving from optional to expected at enterprise HR teams
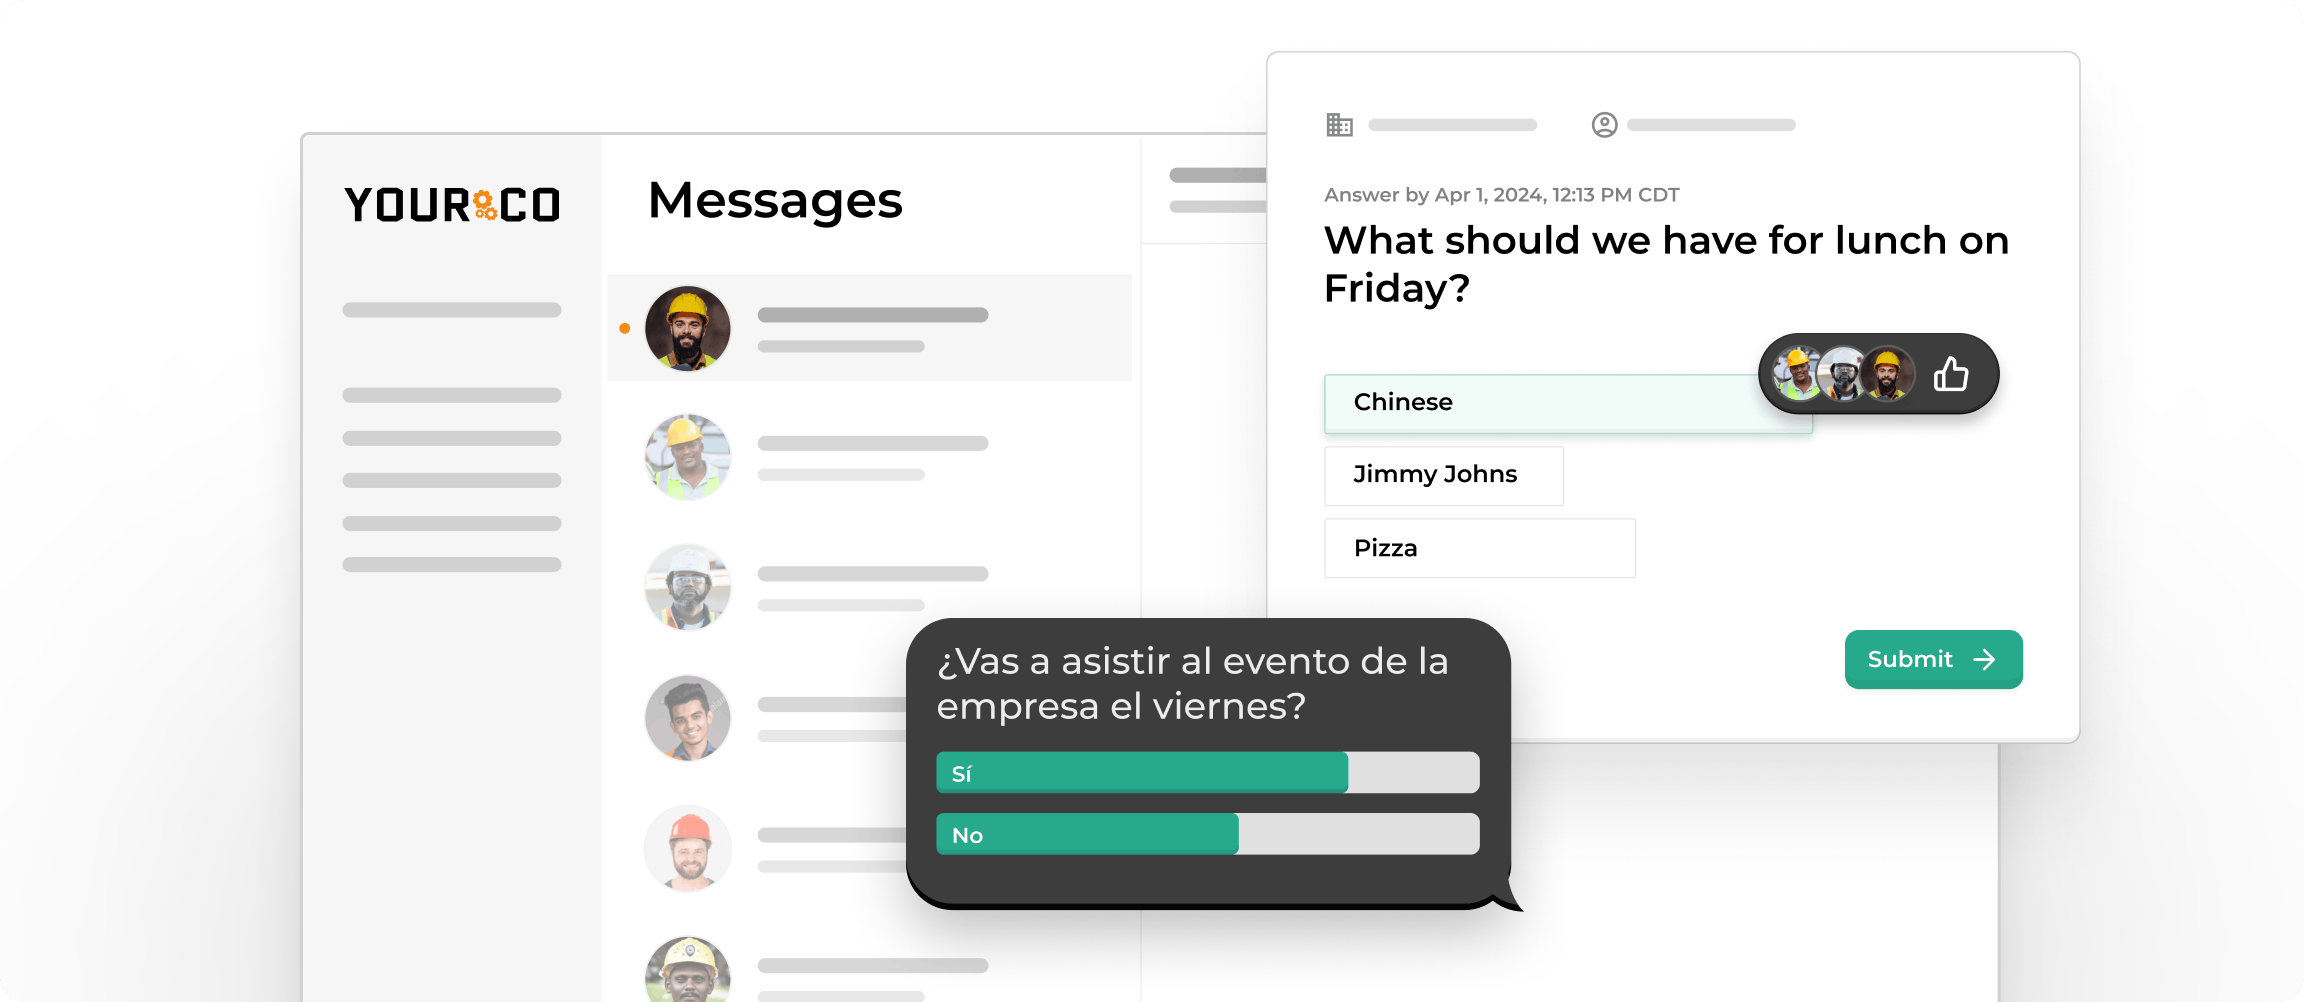
- SMS-based platforms like Yourco help HR teams close the communication gap that drives disengagement and poor metric performance across frontline populations
Track Retention Metrics That Reveal Hidden Turnover Patterns
The overall turnover rate tells you how many people left. The metrics worth tracking go deeper, separating preventable exits from routine churn and catching problems before they compound.
Voluntary Turnover Rate
The Society for Human Resource Management (SHRM) formula: divide total voluntary separations by average headcount, then multiply by 100. The U.S. median sits at 13.0% for 2024-25, according to Mercer's 2025 US Turnover Survey, with retail and wholesale already at 26.7%. Hospitality, logistics, and food services routinely push that number far higher.
Regrettable Attrition Rate
Regrettable attrition isolates the departures that hurt the most. Calculate it by dividing the number of high-performers or critical-skill exits by total headcount at the start of the period. A stable overall attrition rate can mask a spike in regrettable departures. No published cross-industry benchmark exists for frontline-specific regrettable attrition, so establishing your internal baseline and tracking the trend are essential.
90-Day New Hire Quit Rate
This rate signals hiring or onboarding failures rather than broader engagement issues. Divide the number of new hires who left within 90 days by the total hires in that window. SHRM research finds that the first year is the hardest retention period for many frontline workers. Tracking 90-day quits separately helps you catch onboarding breakdowns early.
Approximately 40% of annual wages is what Gallup estimates it costs to replace a single frontline employee. Much of voluntary turnover is preventable. 88% of HR leaders say better communication tools can decrease employee churn, according to a Yourco-commissioned survey of 150 HR leaders, reinforcing why retention metrics tied to communication gaps deserve priority attention.
Measure Engagement Signals Before They Become Exit Interviews
Engagement metrics reveal disengagement before it shows up in turnover numbers. Once an employee gives notice, the options narrow fast. 92% of HR leaders say improved communication would boost front-desk employee engagement, according to the same Yourco research.
The indicators below tell you who's disengaging and where your frontline engagement efforts are falling short:
- eNPS (Employee Net Promoter Score): A single eNPS index tracks employee sentiment over time. Quarter-over-quarter improvement matters more than industry averages, according to QuestionPro's 2025 eNPS benchmarks, with a 27-point gain in the food service sector.
- Absenteeism Rate: 3.2% of the U.S. full-time workforce was absent on any given workday in 2024, according to the Bureau of Labor Statistics, and frontline-heavy industries run above that. Calculated as unplanned absent hours divided by scheduled hours, the rate is most useful tracked by site, shift, and manager rather than as a single company-wide number.
- Recognition Frequency: Gallup-Workhuman research found that well-recognized employees are 45% less likely to have left within 2 years. Recognition frequency correlates directly with retention across frontline populations.
- Pulse Survey Response Rates: rates rise when managers act on results and fall when they don't, according to the Perceptyx report. Workers without company email or regular access to devices rarely receive digital surveys at all.
Quantify Productivity to Build the Business Case
Productivity metrics translate turnover and engagement problems into the language the C-suite responds to: dollars and output. Below are three metrics that make that case:
- Revenue Per Frontline Employee (RPE): total annual revenue divided by frontline full-time equivalent (FTE) headcount. Use frontline FTE only in the denominator to isolate operational efficiency. SHRM notes that turnover directly raises the cost of maintaining output.
- Time-to-Productivity: days from start date to sustained role proficiency. Combine high turnover with long ramp-up times, and the compounding cost runs well beyond the direct replacement expense.
- Industry Output Metrics: Manufacturing tracks Output Per Labor Hour and OEE; Logistics tracks Units Per Labor Hour; Hospitality tracks Labor Cost Per Occupied Room, which rose year-over-year in 2025.
Prioritize Training Completion and Internal Mobility
Training and development metrics help predict whether frontline employees stay past their first year and whether they perform at the level your operation needs.
Training Completion Rate
Raw completion numbers don't show whether training actually landed. Frontline workers consistently report gaps between what training covers and what the job actually requires, and SHRM identifies the root cause as L&D formats requiring logins, installations, and screen time that frontline workers cannot access during a shift.
Tracking completion by modality alongside manager-reported proficiency assessments gives a more honest picture of whether training is working.
Internal Mobility Rate
Internal mobility rate measures the number of internal moves divided by the total number of employees over a given period. Only 32% of L&D leaders currently track it, according to the LinkedIn Workplace Learning Report, which is a significant oversight given that SHRM consistently finds frontline workers stay longer at organizations where advancement is visible and attainable.
High-performance organizations with upskilling programs are nearly 2x more likely to report workforces with the skills to meet future demands, according to i4cp research. Tracking internal mobility by department and tenure cohort identifies where advancement pathways are working and where they are stalling.

Reduce Time-to-Fill for Frontline Roles
Every unfilled frontline position puts extra work on the remaining staff while the hiring clock runs. For frontline roles, time-to-fill pressure is compounded by high application volume and short candidate availability windows.
Many organizations benchmark 14 to 21 days for hourly and entry-level frontline positions, though the right target reflects the specific role, location, and labor market conditions. High-volume hiring teams frequently report Day-1 no-shows, often because candidates accept other offers while waiting through longer screening processes.
Tracking cost-per-hire alongside time-to-fill keeps speed decisions honest. A compressed hiring cycle that skips screening steps may reduce time-to-fill while raising 90-day quit rates, which produces the same replacement costs through a different route.
Together, they reveal four distinct failure modes:
Adopt Predictive Analytics for 2026 and Beyond
Enterprise HR faces growing pressure to shift from descriptive reports to predictive analytics that identify employees at risk of leaving. Sapient Insights' 2025 report highlights advancements in analytics for frontline workforce management, aligning with Gartner's 2026 HR priorities as one of the top HR priorities for 2026.
Predictive Flight-Risk Scores
Predictive flight-risk scores use classification and survival analysis models to surface likely leavers before they resign. These models draw on a combination of tenure data, pay competitiveness, engagement trend signals, absence pattern anomalies, and performance trajectory.
The most actionable implementations translate composite risk scores into manager-level alerts, giving HR and direct supervisors a specific employee and a reason to have a conversation, rather than a spreadsheet to review after the resignation is already filed.
Manager Effectiveness Composites
Gallup's research shows manager quality explains 70% of the variance in team engagement, and manager engagement fell to a record low of 22% in 2025, according to the State of the Global Workplace 2026 report, the largest single-year drop on record.
A manager's effectiveness composite typically combines that manager's team retention rate, their team's engagement score, internal mobility outcomes for direct reports, and absence trend data. Tracked quarterly, this composite provides HR with a leading indicator of teams quietly eroding, well before exit interview data confirms it.
Turn Frontline Metrics Into Action With Yourco
Tracking frontline workforce metrics only creates value when you can actually reach the workers those metrics describe. Yourco gives enterprise HR and operations teams a direct communication line to every frontline employee, enabling engagement surveys, recognition programs, frontline employee training, and early-warning analytics at scale.
Yourco's core capabilities include:
- SMS to any phone: no app download, no WiFi, no data plan required, including basic phones and flip phones
- Two-way messaging: real-time feedback and response between frontline employees and managers
- AI-powered translation: 135+ languages and dialects, delivered automatically in each employee's preferred language
Yourco integrates with 240+ HRIS and payroll systems, automatically syncing new hires, role changes, and terminations to keep communication consistently up to date across all locations.
Enterprise Bridge enables one-way broadcasts from corporate leadership to the entire frontline, keeping every location aligned while local managers maintain direct communication with their teams.
Frontline Intelligence gives HR and leadership teams centralized visibility into engagement trends, call-off patterns, and sentiment shifts across all locations, departments, and custom groups. It surfaces disengagement signals across locations and departments, tracks which sites show declining engagement scores, and delivers AI-powered reporting on absence causes and attendance patterns.
"We have nearly 700 employees and 80% are non-desk based, communication is a challenge. Yourco provides a quick easy way to reach everyone and a secure way for employees to reach HR and leadership without a computer."
Felisha Parker, VP Human Resources, McCarthy Auto Group
After 90 days on Yourco, companies see two-way employee engagement reach 86%.
Try Yourco for free today, or schedule a demo to see the difference the right workplace communication solution can make for your company.

Frequently Asked Questions About Frontline Workforce Metrics
What is the average cost of replacing a frontline employee?
Replacing a frontline employee typically costs several months of that employee's wages, including recruiting, onboarding, training, and lost productivity. The exact amount depends on the role, the training required, and how long it takes a new hire to reach steady performance.
How do you calculate the 90-day new hire quit rate?
Divide the number of new hires who leave within their first 90 days by the total number of hires in that same period. This metric helps you separate onboarding and hiring problems from broader retention issues across the rest of the frontline workforce.
What engagement metrics matter most for frontline workers?
The most useful engagement metrics are eNPS, absenteeism rate, recognition frequency, and pulse survey response rates. Together, they show whether morale is slipping before turnover rises. SMS-based platforms like Yourco also make these signals easier to collect across frontline populations without regular email or app access.
How accurate are predictive flight-risk models for frontline employees?
Predictive flight-risk models are most useful when they combine multiple signals rather than relying on a single score. Their value comes from helping HR teams spot patterns in tenure, engagement, absences, and performance early enough to investigate and respond before regrettable departures happen.
Why is the internal mobility rate important for frontline retention?
Internal mobility rate matters because frontline workers stay longer at organizations where advancement is a real possibility. Promotions, transfers, and role changes signal that growth is possible, which helps HR leaders connect development efforts to longer-term retention.
What is a good eNPS score for frontline industries?
A good eNPS score depends on the industry and the makeup of your specific workforce. What matters most is whether your score improves over time relative to your own baseline and whether location-level differences indicate manager or operational issues that need attention.